
Same story on Monday — Finance, IT, and everyone else. Without the shenanigans.
Overruns, delays, and demos that don’t survive migration. We build the data lakehouse and the semantic layer so the app and the board pack match.
Overruns, delays, and demos that don’t survive migration. We build the data lakehouse and the semantic layer so the app and the board pack match.
Six checks
Count how many you can answer today without rebuilding a spreadsheet.
History — After someone edits the live Dynamics/Xero/SaaS row, can you still show the customer or invoice as it stood at month-end?
One version — Is there one margin for last month that finance and ops would both sign?
Delivered vs billed — Can you split revenue you delivered from revenue you billed?
The movement — If a P&L line moved, can you name the vendor or account without opening a workbook?
Foundations — Do the numbers move when nobody is in Excel or Desktop?
Who owns it — If the board asks who owns this figure, is the answer a person and one definition?
0 of 6 yes
Three screens
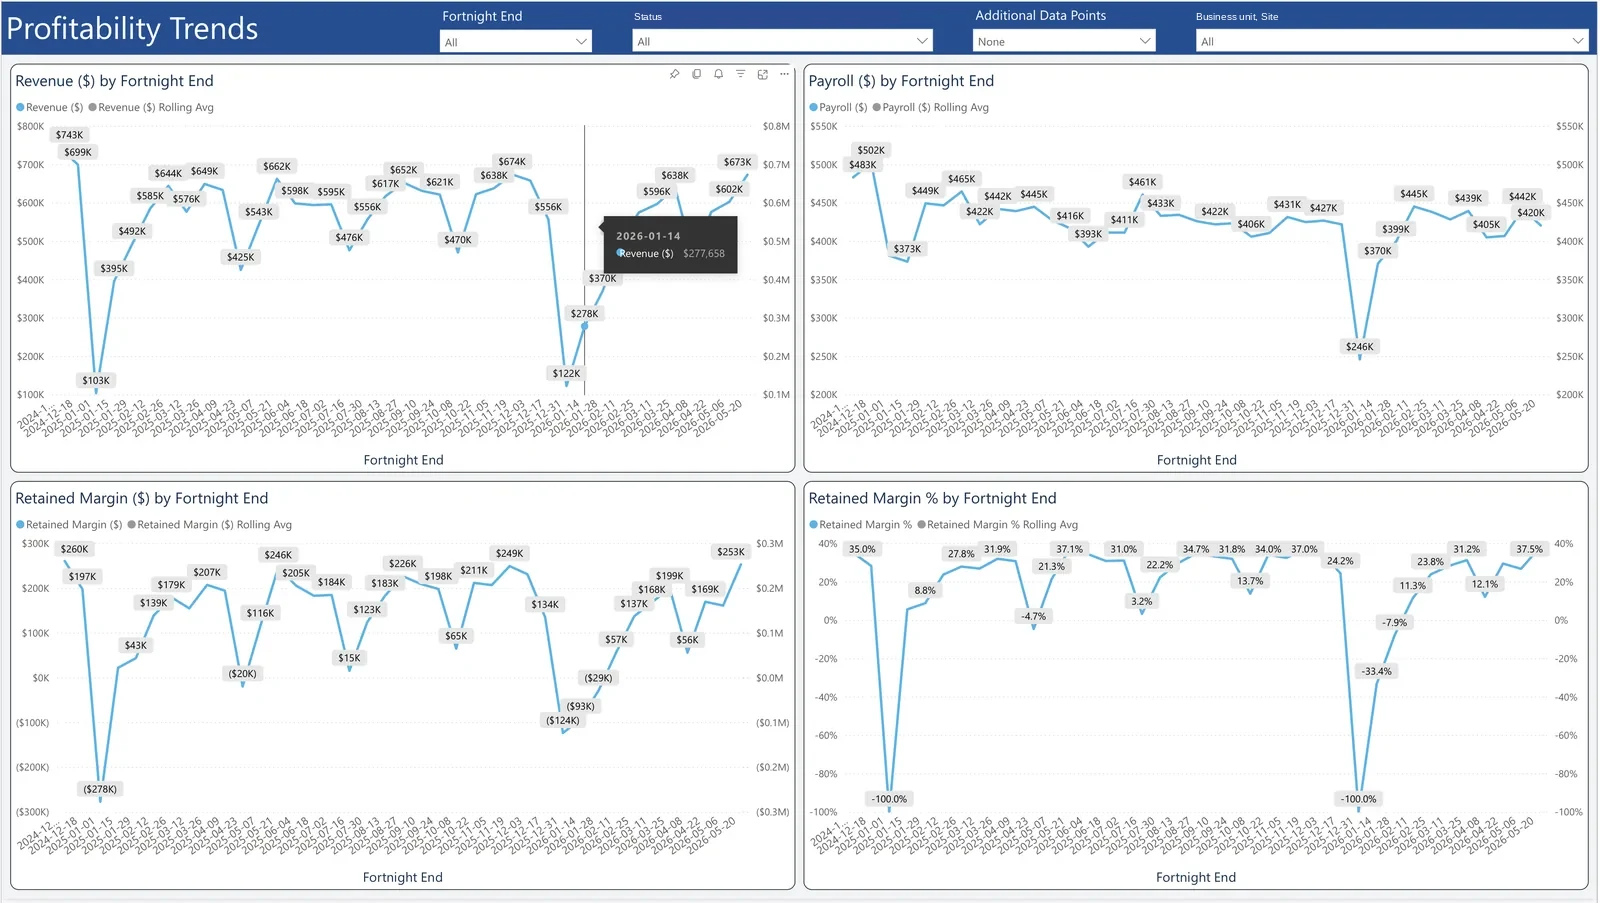
For a CFO
Revenue, payroll, and retained margin (dollars and percent) by fortnight, each against a rolling average. The useful read is where margin compressed, and on which pay run it went negative.
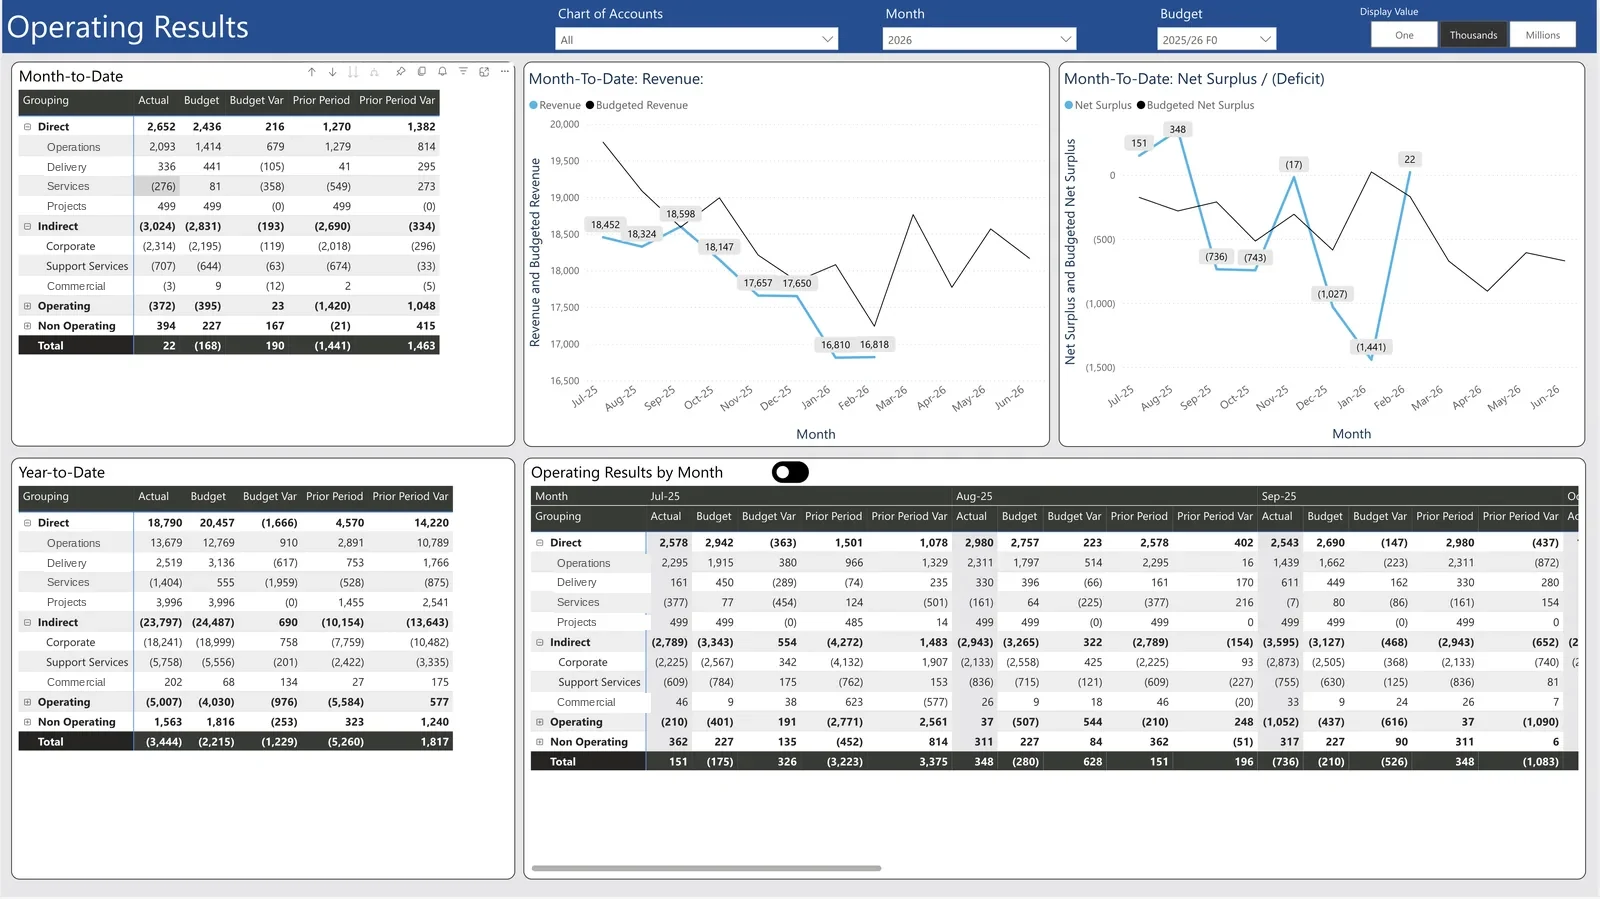
For a CFO
Month-to-date and year-to-date P&L against budget and prior period, with monthly actuals underneath. The meeting should start on the variance, not on which file is current.
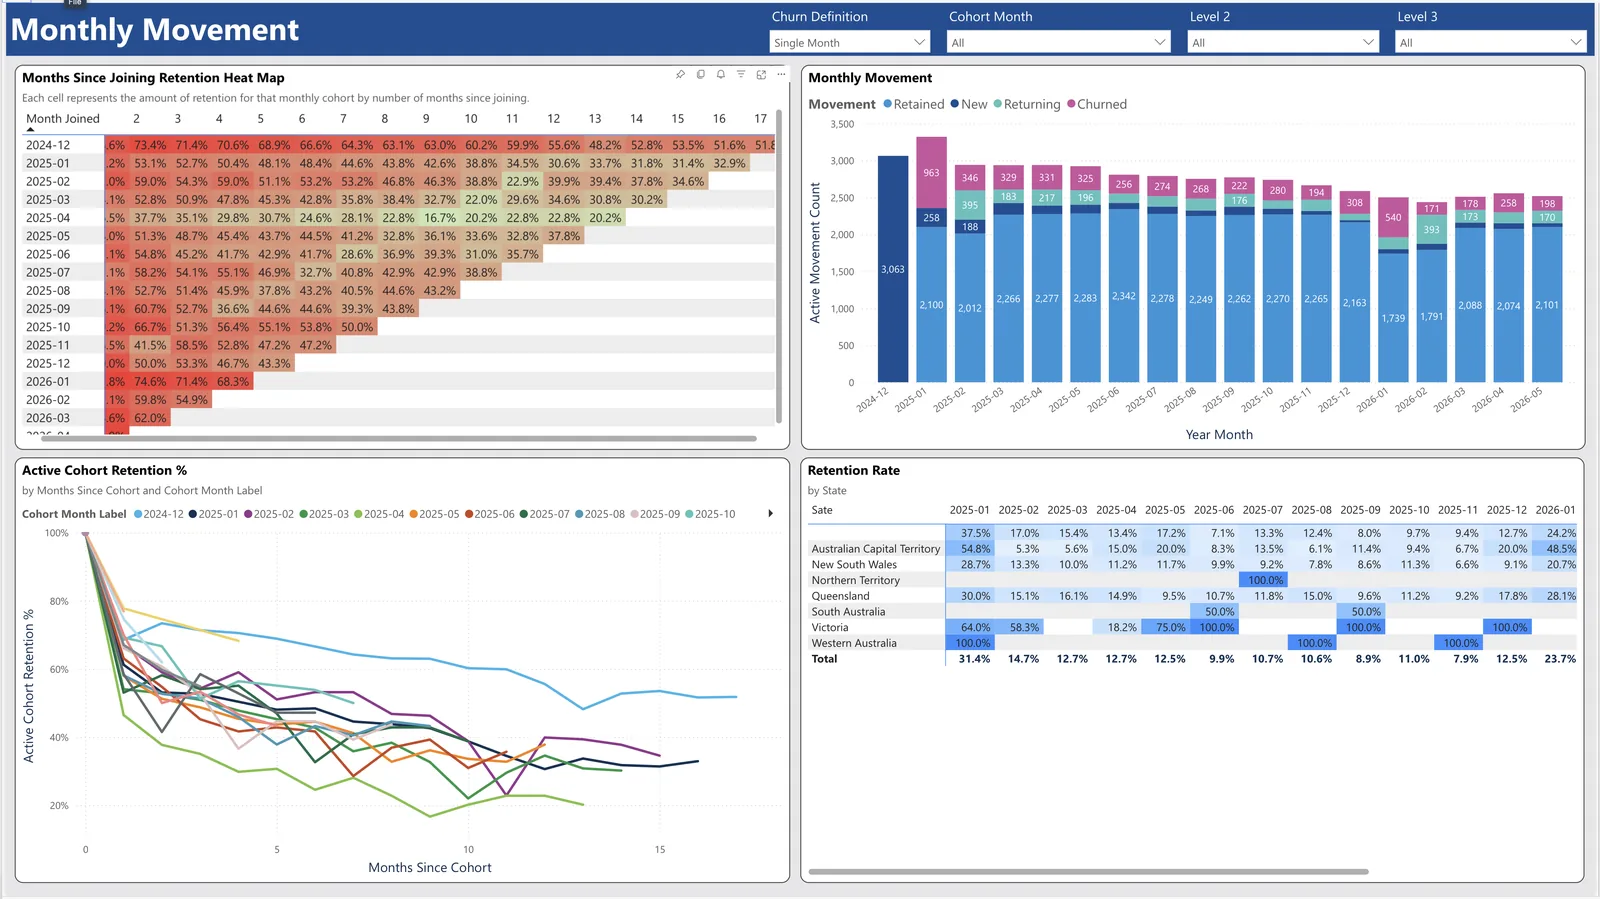
For operations
Retained, new, returning, and churned, month by month, plus a months-since-joining heat map. The useful read is who left, and how long they had been in.
Portfolio
Ask for a private link. It comes by email and lasts 24 hours.
We send the link. We don’t sell your email. No newsletter.
What they said
“Luke transformed our raw data into clear, professional reports.”
 Josh MillerCEO, Savile (RTO 45452)
“Gave our leadership team the clarity we needed.”
Production Microsoft Fabric: lakehouse, incremental pipelines, semantic models, CI/CD. The architecture is the product. Dashboards are what you look at; the model is what you defend.
One governed model for P&L, contribution, and operating results. Leadership reads the position in minutes and spends the meeting on the decision. Copilot reads the same semantic layer the board does. Same definitions. Not a chatbot.
Incremental loads from ERP and CRM into a Fabric lakehouse, then a semantic model on top. Delivered with Power BI and Microsoft Fabric. If it only exists as a Desktop file, it is not in production.
Start with the tables and definitions that change the next board pack. Grow the platform when the first slice is trusted. The team that has to live with it gets the model, not a black box.
Streamline Analytics
Streamline, Melbourne. Production Fabric. The numbers have to hold up in the room.
Cross-functional delivery between finance, IT, and operations. Accountable for the reporting layer that gets used, not a slide of architecture.
Microsoft Fabric and Power BI in production, with AWS and the rest of the stack when that is what the source systems already are.

Streamline Analytics
Send the systems you run and the decision in front of you. Reply within one business day.
We use this to reply. We don’t sell your email. No newsletter. Privacy